
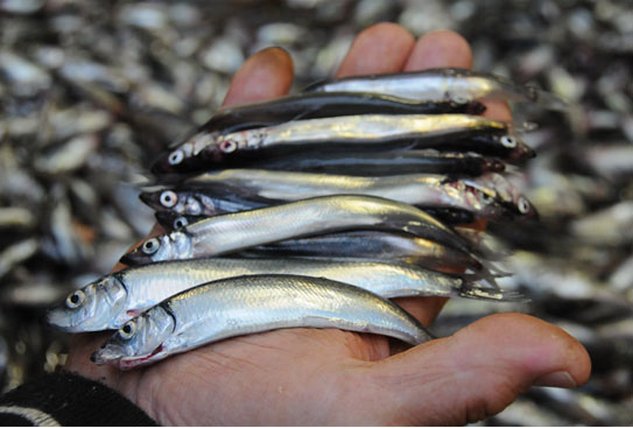
Capelin (Mallotus villosus) and Atlantic herring (Clupea harengus) caught in the Barents Sea. Populations of both species, which are important forage fish in the Barents Sea and Norwegian Sea ecosystems, are known to fluctuate strongly over time because of large variability in recruitment and mortality; moreover, because capelin is a major prey item for juvenile herring, the cohort strength of herring depends on the stock biomass of capelin, and vice versa. Photography by L. Nøttestad/Havforskningsinstituttet.
New study finds that the recent recovery of Northeast-Atlantic fish stocks has been driven by improved management
Indications that the state of European fish stocks is improving have been accumulating in recent years, yet it remained unclear how general this pattern is and whether these trends were driven by changes in fisheries regulations or fluctuations in stock productivity.
The results illustrate that an improved and more sustainable exploitation of Northeast-Atlantic fish stocks was triggered by an improved fisheries policy targeting the maximum sustainable yield under a precautionary approach. But goals outlined in the CFP and to which the EU member states are committed have not yet been fully reached and continued success is still under threat by ongoing environmental changes such as increasing temperatures and ocean acidification.
The ecological effects of these changes are diverse and require case-specific and science-based advice. For instance, more northern stocks, such as the ones from the Barents Sea, typically benefit from higher water temperatures, while at the southern boundary of their distribution many stocks increasingly struggle under rising temperatures. Key examples for these dynamics are Atlantic cod and herring. Both species are close to their upper thermal limit in the Baltic and North Sea and could be under increasing pressure from more southerly distributed species expanding northwards. In the North Sea, changes in the distribution of species such as the European hake result in increased competition for species like cod, which occupy a similar ecological niche and must therefore be accounted for in fisheries management.
The authors of the study emphasize that fisheries can indeed be managed sustainably if the political will is in place. This can lead to surprisingly quick improvements, but environmental changes remain a factor of uncertainty, underlining the need for continued improvements in science-based management and cautious fisheries policies that adhere to a precautionary paradigm.

Mean normalized spawning stock biomass (SSB, black line), catches (red line), and recruitment (blue line) of 85 Northeast Atlantic fish stocks from 1960 to 2015, along with standardized total effort (inset graph, gray line) of the EU fleet and total catches (inset graph, dark red line) for the years 2003–2014. For each stock, time-series of SSB, recruitment, and catch data taken from official stock assessment reports were normalized to the mean and standard deviation of each time-series, and subsequently used to calculate the mean over all stocks from all available data in each year. Total annual fishing effort (kilowatts × days at sea) and summed annual catch (kilograms) were standardized to the mean of their entire time-series. Bars along x axis denote number of stocks with available data in each year. Shaded areas around point estimates indicate the 95% confidence intervals.